Pre- vs Post-Therapy Analysis using QIKtest
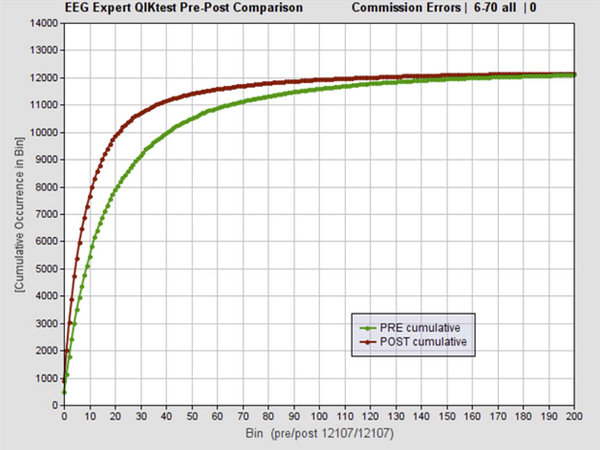
The figure below shows the cumulative distribution for impulsivity data on 12,100 neurofeedback clients who had infra-low frequency neurofeedback training. No exclusions. These data represent some quarter million sessions of Infra-Low Frequency neurofeedback.
As Barry Sterman would say, “If you cannot tell the difference, then you need an optician more than you need a statistician.”
Horizontal Axis, Bin: Number of Commission Errors
Cumulative distribution of commission errors observed with the QIK Continuous Performance Test before and after nominally twenty sessions of Infra-Low Frequency (ILF) neurofeedback training with Cygnet software and Othmer protocols, for some 12,100 clients. The post-training distribution (in red) matches the normative distribution for commission errors on the deficit side and exceeds normative performance at and above the mean. The data cover the age range of 6-70.
November 2017, EEG Expert
Dr. Siegfried Othmer, Marco Versace

